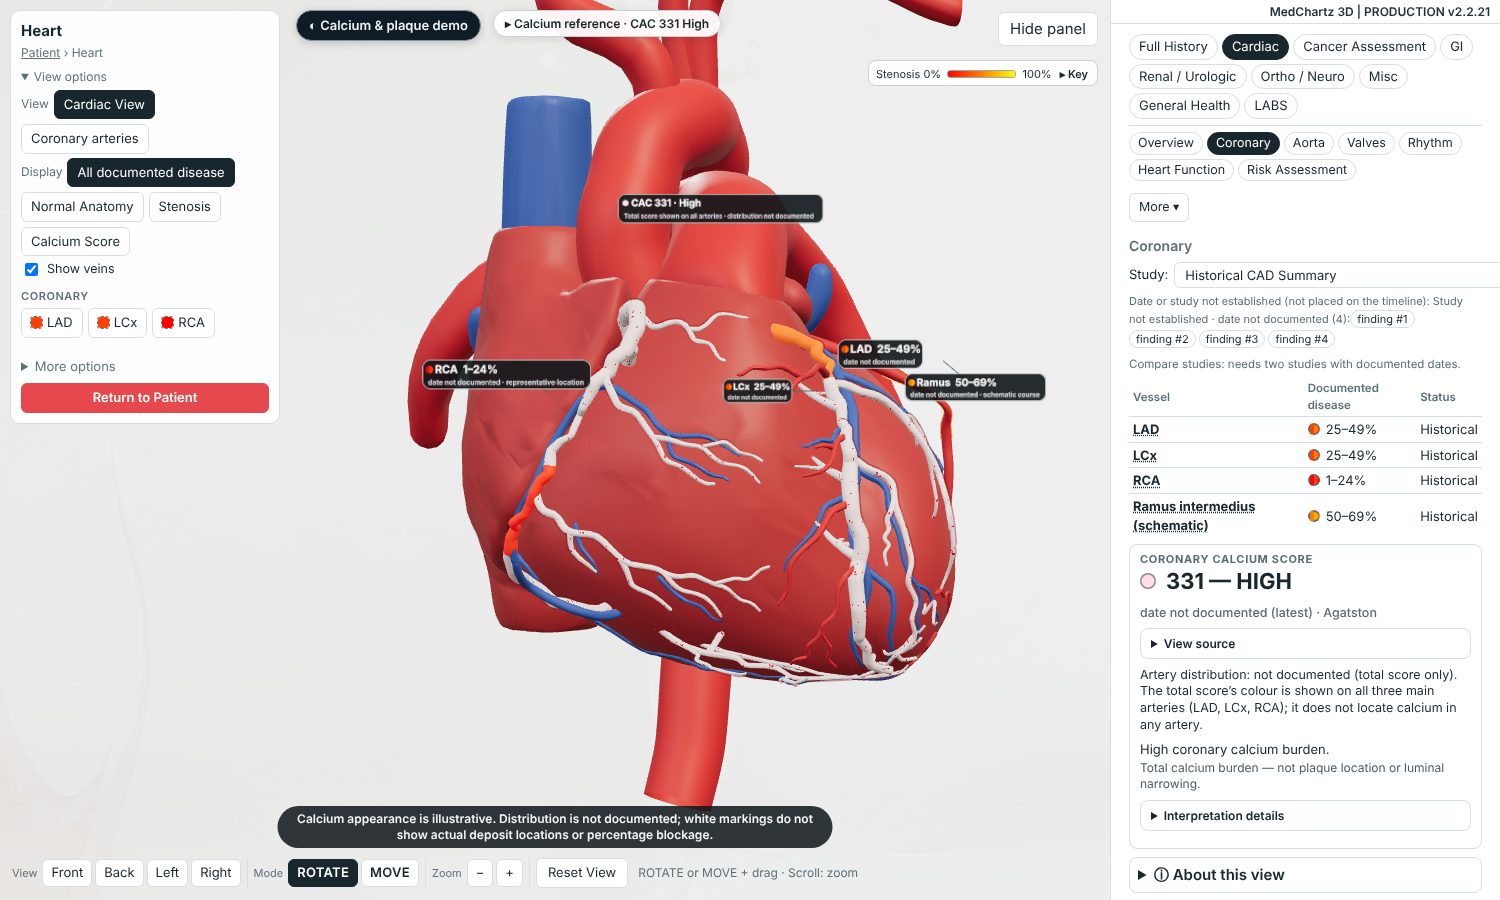
Explain coronary disease in seconds
Reported narrowing, drawn on the right vessel.
Bring chart findings, lab trends and patient education into one visual conversation.
Interactive 3D anatomy, visual education and report-linked clinical insights—designed to make patient conversations clearer.
Checked against release v2.2.21 (November 12, 2026)
Reported narrowing, drawn on the right vessel.
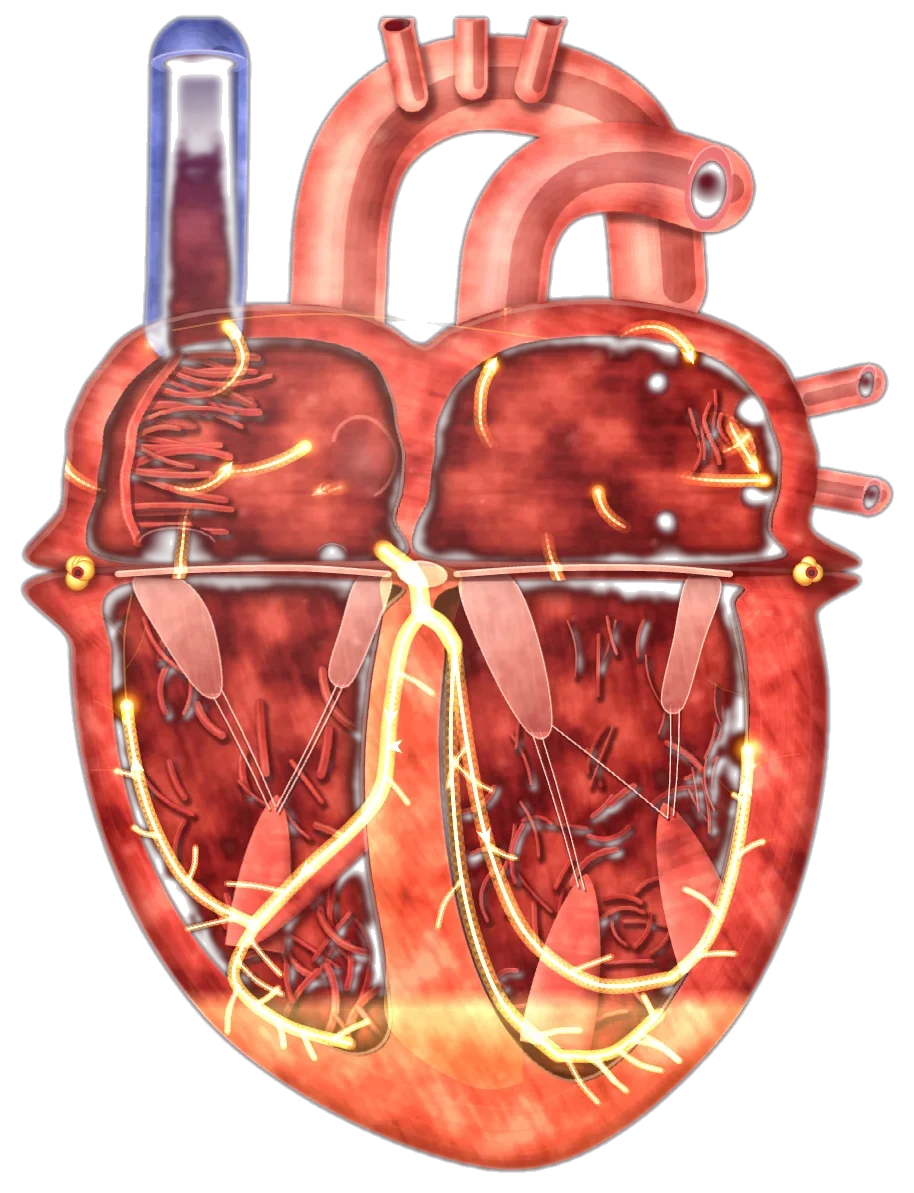
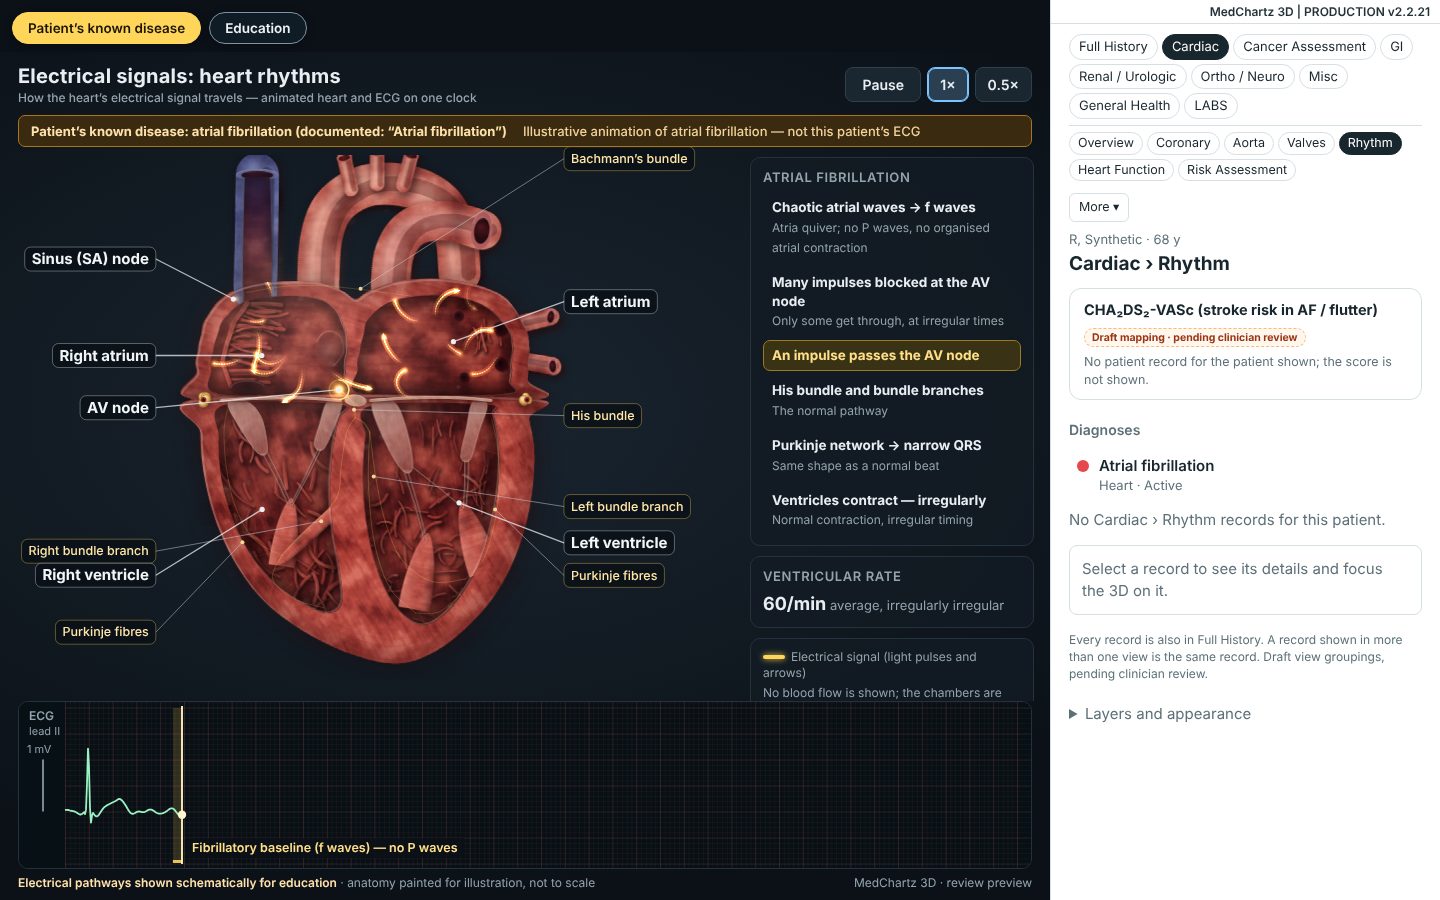
The patient’s documented rhythm, heart and ECG moving together.
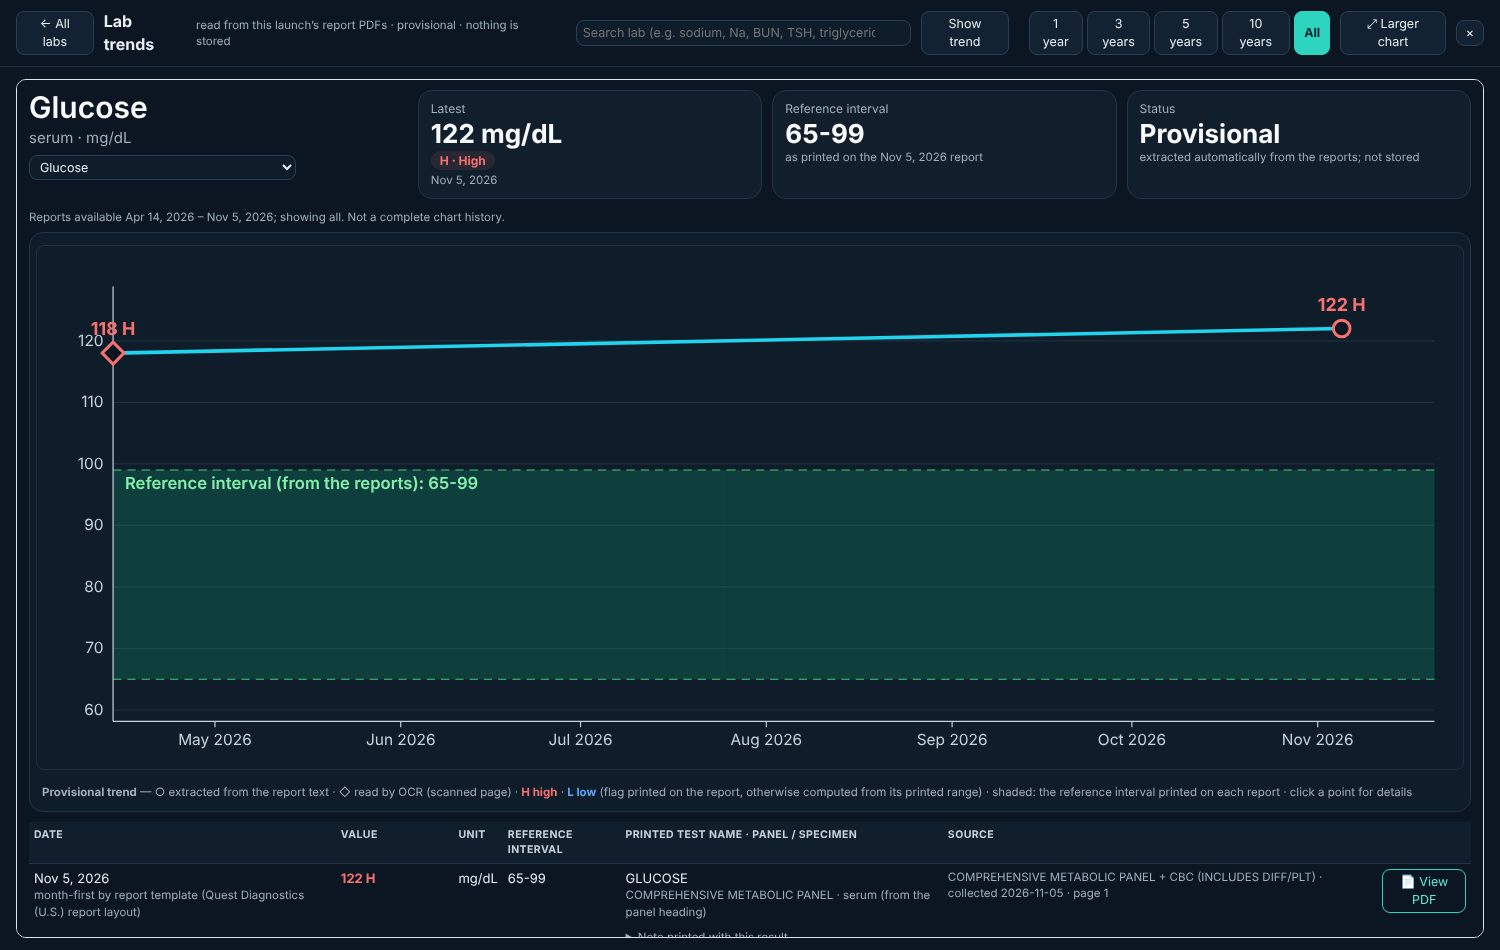
Any lab over time, from the authorized reports, against each report’s printed range.
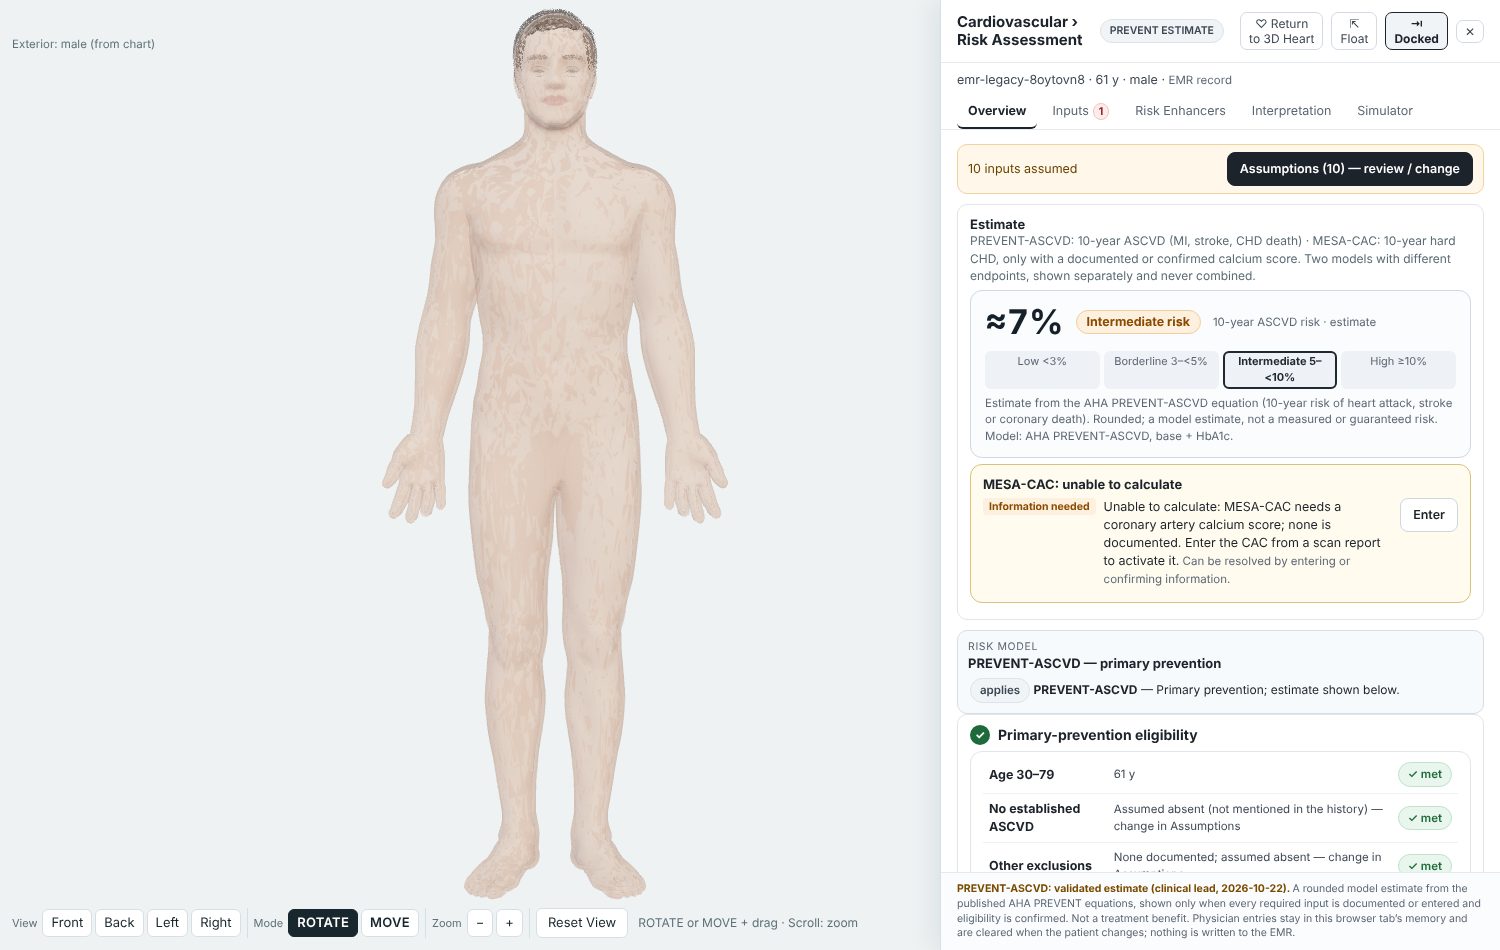
A 10-year PREVENT estimate, ready when you open it, from chart vitals and labs.
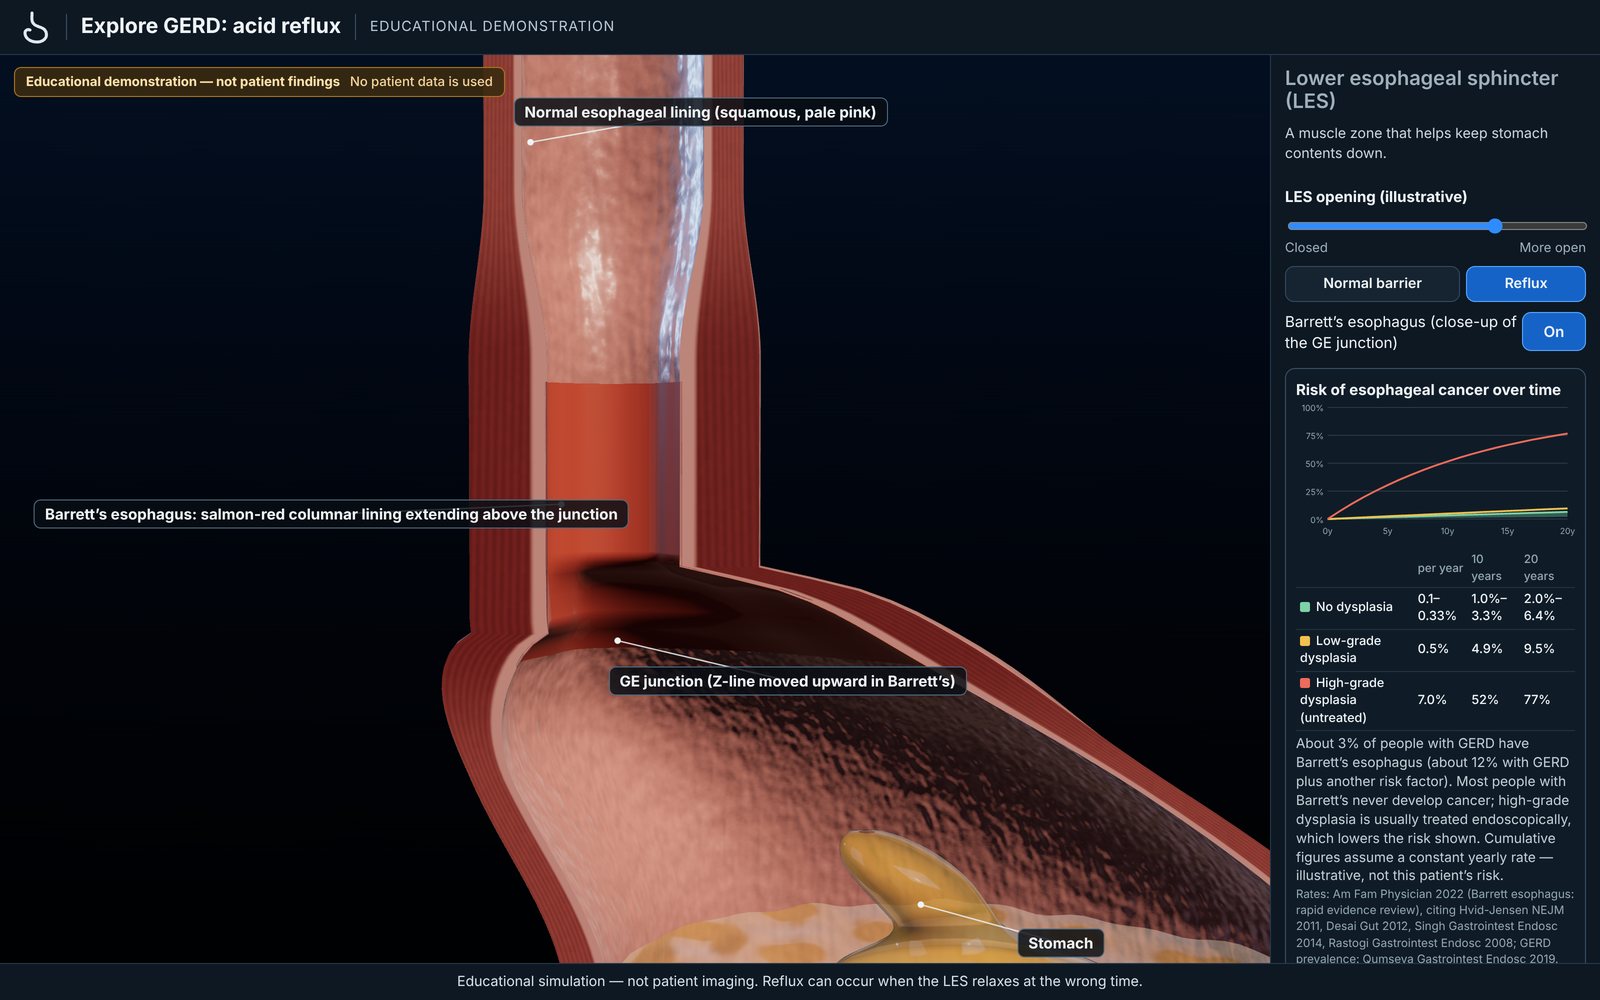
Guided 3D demonstrations, such as Barrett’s esophagus at the GE junction.
Start in your EMR with the patient you are seeing.
It opens for that patient from inside the EMR, using the EMR’s own sign-in.
Turn the model, open a demonstration, or bring up a lab trend while you talk.
Back to the chart, with nothing written into it.
Currently integrated with MedChartz EMR; additional integrations evaluated individually.
MedChartz 3D opens from the chart for the patient you have open, using the EMR’s own sign-in.
Planned Cardiac report interpretation and Colonoscopy follow-up reminders: in development, not available today.
No. It opens from within the EMR for the patient you have open, and reads from the chart. It does not write anything back.
Currently integrated with MedChartz EMR; additional integrations evaluated individually. Tell us which EMR you use when you request a demo.
The problem list, history and vitals, plus the authorized reports that the EMR integration supplies for that patient. It does not read every document in the chart. Scanned reports are read with text recognition.
Chart data is read when the viewer opens and kept only temporarily for that session. MedChartz 3D does not keep its own copy of the chart.
They are read automatically and shown as provisional, with the source page one click away. Check them against the original report before relying on them.
Not yet. Both are planned and are not part of the current product.
The anatomy is a standard 3D model with the patient’s documented findings placed on it. Rhythm and condition animations are illustrations, labelled as such, not recordings of the patient.
If the history lists hypertension or hyperlipidemia, treatment is assumed; other yes/no factors default to no unless documented. Every assumption is listed with its reason and can be changed. Missing numbers are never guessed.
No. It is a visualization and education tool. Risk estimates use published equations and list every assumption; clinical judgment stays with you.
We will show MedChartz 3D with a synthetic patient and talk through how it would connect to your EMR.
Email us with your name, practice and the EMR you use. Please do not include any patient information.
Request a demo by emailOr write to [email protected]